
STATISTICAL ABSTRACT
METHODOLOGY OF THE STATISTICAL STUDY
The title of each graph of the statistical study indicates the parents' variables (R or M & F) to which the correlations relate. Each point of the colored lines represents the correlations with the observational C variables of the children.
Likewise, the variables of unknown order, formed by the different groups of 1 to 10 values from the 70 IQ values of each parent and children variables, appear on the left-hand side of the graph. The criteria order of the groups of 1 to 10 values located on the right-hand side is the variable mentioned at the bottom of the graph.
Each graph condenses more than 5,000 different points of information for the interrelations between:
- 70 values of each IQ variable of the fathers, mothers, and children
- 8 variables of the IQ of fathers, mothers, and children
- 3 variables of individual averages of the previous variables
- 10 criteria of value arrangement
- 10 sizes of groupings of individuals
- 20 values of evolution’s parameters in a sensitivity analysis
- Countless random variables created in the simulation model
The set of graphs collects all these interrelations, that is, more than 1,000,000 values. Note that the average of any two values has a dynamic that is independent of the two values.
An example of the data source could be having a historical sample of 70 packets of cigarettes. However, the sample can be of 70 elements, or many more if, for each packet, the analysis would consider the following aspects:
- The number of cigarettes per packet
- The size of the cigarettes
- The type of cardboard the packet has
- The color
- If it has any images
- If it has any health warnings
- The type or severity of these warnings
- Information about the level of nicotine and tar

The graphs show a instantaneous perception of the goodness-of-fit of a specification; they represent sixty coefficients of determination (r²) that highlights the underlying relations of the involved data.
In order to facilitate the comparative analysis, there is a multidimensional correlation index (from now on MCI) to represent with one number the global precision of the adjustments shown in any graph. It will be the sum of the determination coefficients of the ten rearranged variables.
There will be an MCI for each variable and a Global MCI for the three variables studied in each graph. The maximum GMCI will be 30 since the graphs always contain three variables and ten groupings.
On the right-hand side and below the variable, there are the r² and the GMCI to help to understand the correlations involved.
The results are surprising, which can be observed both in the graphs of the statistical annex and in the following tables. An aspect that will allow reaching some crucial conclusions is the model sensitivity of the arrangement criterion.
DATA SOURCE
| |
| * | These variables are the criteria to rearrange the groups in some instances. |
| ** |
These variables are the criteria to rearrange the groups in some instances, but only in the statistical survey to verify the method of Logical Verification of Information (LoVeInf) and the exceptional cases of the progenitors in the Curiosities section. |
| ° | These variables, in some instances, incorporate the effect of the statistical survey evolutionary parameters. |
| *R° | The objective function R of the statistical study arises from the General Theory of Conditional Evolution of Life (CEL), Mendelian genetics significance, and applying the method LoVeInf to the intelligence quotients of the mothers (M) and fathers (F). Function R is the mathematical expected average of the capacity of the children in agreement with the CEL, and it will be the sum of the expected averages of each one of the cases weighted by their probabilities, according to the Mendelian genetics. |
| M&F | Two IQ vectors of a statistical regression using ordinary least squares with one IQ vector of the children. |
| T1 | IQ vector of children. Original variable from the Young Adulthood Study – Stanford-Binet intelligence test |
| T4 | IQ vector of children. Original variable from the Young Adulthood Study – Stanford-Binet intelligence test applied when children were 12 years old. |
| *WB | IQ vector of children. Original variable from the Young Adulthood Study – Wechsler Bellevue intelligence test applied when children were 13 years old. |
| T1-d | IQ vector of children. T1 with smoothed tails, 10% of X6 |
| X3 | IQ vector of children. Mean of three original variables from the Young Adulthood Study. |
| *X6 | IQ vector of children. Mean of six original variables from the Young Adulthood Study. |
| *W° |
Children vectors of artificial intelligence quotients are generated by the computer simulation of the Conditional Evolution of Life, they should behave like the children's observational data source. |
| *(M+F)/2 | Vector of IQs produced by the semi-addition of the IQs of the mother M and the father F. |
| *M1F1° | Vector of IQs obtained with the lowest value of M and F of each family, either the intelligence quotient of the father or the intelligence quotient of the mother. |
| **M |
IQ vector of the mothers, original variable from the Young Adulthood Study – OTIS intelligence test |
| **F |
IQ vector of the fathers, original variable from the Young Adulthood Study – OTIS intelligence test |
| **2F2M | Vector of IQs obtained with the highest value of M and F of each family, either the intelligence quotient of the father or the intelligence quotient of the mother. |
STATISTICAL MODELS
q023
Back to Globus Model
q024
Back to Globus Model
| Order | Objective function | |||||
| R | M & F | |||||
| Graphs | GMCI | r² max. | Graphs | GMCI | r² max. | |
| 3 - Original variables T1, T4, and WB | ||||||
| M | q031 | 8,48 | 0,61 | q032 | 9,16 | 0,69 |
| F | q033 | 9,44 | 0,59 | q034 | 12,52 | 0,78 |
| 2F2M | q035 | 7,55 | 0,61 | q036 | 10,25 | 0,73 |
| 4 - Centered variables T1-d, X3 and X6 | ||||||
| M | q041 | 11,79 | 0,67 | q042 | 12,14 | 0,71 |
| F | q043 | 12,28 | 0,69 | q044 | 14,38 | 0,80 |
| 2F2M | q045 | 9,20 | 0,56 | q046 | 12,39 | 0,70 |
| Order | Objective function | |||||
| R° | M & F | |||||
| Graphs | GMCI | r² max. | Graphs | GMCI | r² max. | |
| (M+F)/2 | q051° | 11,73 | 0,62 | q052 | 13,05 | 0,80 |
| M1F1° | q053° | 10,91 | 0,79 | q054° | 13,04 | 0,79 |
| R° | q055° | 10,83 | 0,73 | q056° | 12,63 | 0,94 |
| WB | q057° | 12,26 | 0,89 | q058 | 14,68 | 0,99 |
| ° Internal evolution parameters affect the objective function R and M1F1 order | ||||||
q055 
q056
Back to family study
| Order | Objective function | |||||
| R° | M & F | |||||
| Graphs | GMCI | r² max. | Graphs | GMCI | r² max. | |
| (M+F)/2 | q061° | 14,70 | 0,77 | q062 | 16,03 | 0,80 |
| M1F1° | q063° | 15,61 | 0,89 | q064° | 17,77 | 0,89 |
| R° | q065° | 15,55 | 0,84 | q066° | 17,40 | 0,97 |
| X6 | q067° | 15,05 | 0,91 | q068 | 17,20 | 0,88 |
| ° Internal evolution parameters affect the objective function R and M1F1 order | ||||||

q063 
Back to Globus Model
Back to family study
q064 
Back to Globus Model
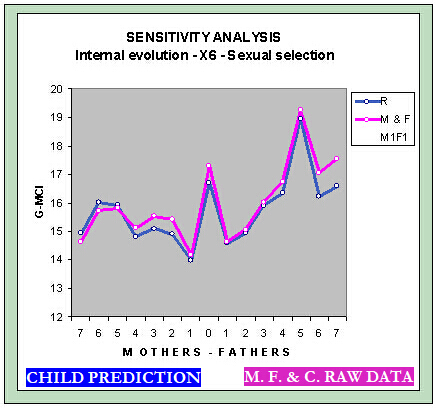
INTERNAL EVOLUTION SENSITIVITY
|
Parameters Internal Evo.° |
T1-d, X3, and X6, and arrangement criterion M1F1° | ||||||
| Objective function | |||||||
| Direct | Indirect | R° | M & F | ||||
| Mothers | Graphs | GMCI | r² max. | Graphs | GMCI | r² max. | |
| 5 | 5 | q071° | 14,14 | 0,72 | q072° | 14,46 | 0,72 |
| 3 | 3 | 14,21 | 0,82 | 14,81 | 0,82 | ||
| 1 | 1 | 13,49 | 0,80 | 13,89 | 0,80 | ||
| Null | |||||||
| 0 | 0 | q023 | 14,98 | 0,92 | q024 | 16,07 | 0,92 |
| Fathers | |||||||
| 1 | 1 | 14,06 | 0,83 | 16,10 | 0,87 | ||
| 2 | 3 | 14,79 | 0,87 | 16,10 | 0,87 | ||
| 3 | 3 | 15,33 | 0,84 | 16,47 | 0,84 | ||
| 4 | 4 | 15,09 | 0,84 | 16,73 | 0,84 | ||
| 5 | 5 | q063° | 15,61 | 0,89 | q064° | 17,77 | 0,89 |
| 6 | 6 | 14,30 | 0,95 | 16,74 | 0,95 | ||
| 7 | 7 | 13,25 | 0,83 | 15,56 | 0,83 | ||
| ° Internal evolution parameters affect the objective function R and M1F1 order | |||||||
8 - Family - Identical twin study
| Graphics | Family relationships | Observations |
|---|---|---|
| q071° q072° |
Evolution with IQ Mothers | Adjustment for Globus Model |
| q081 | Relation between children H |
Identical twins |
| q082° | Siblings or dizygotic twins | |
| q083° q084° |
Clones Replica q053° Clones Replica q056° | |
| 1 Mothers q085 2 Mothers q086° |
Progenitors | Rearrangement criteria M and evolution |
| 3 Fathers q087 4 Fathers q088° |
Rearrangement criteria F and evolution | |
| q089° | Sexual selection - Couples | Without sexual selection q063° With - Sexy Globus Model |
q071 
Back to family study
q072 
Back to family study
* * *
When Globus finished the book,
he happily calls Mª José to tell it to her
and asked her:
–Do you think Goblin will like it?–
Mª José replied:
–Don’t worry,
you already know his glimpses of children paranoia!–