STATISTICAL GRAPH
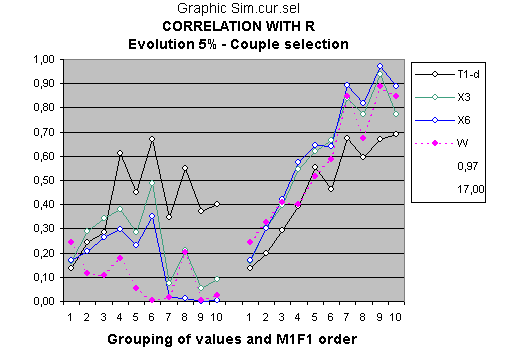
The title of each graph of the statistical study indicates the parents' variables (R or M & F) to which the correlations relate. Each point of the colored lines represents the correlations with the observational C variables of the children.
Likewise, the variables of unknown order, formed by the different groups of 1 to 10 values from the 70 IQ values of each parent and children variables, appear on the left-hand side of the graph. The criteria order of the groups of 1 to 10 values located on the right-hand side is the variable mentioned at the bottom of the graph.
Indeed, there is an almost instantaneous perception of the exactitude of the particular specification of the statistical study; each graph shows sixty coefficients of determination (r²) highlighting the global and underlying relations of the involved data set.
See the methodology of the statistical abstract for more details
STATISTICAL STUDY COMMENTS
1. General statistical significance
The considerable increase of the correlation for the estimation of homogenous groups is not due to the reduction of 68 to 5 or 4 degrees of freedom, since the estimation with non-homogenous groups, without previous rearrangement, has the same degrees of freedom and the correlation even lowers concerning the sample without grouping.
In general, the model of the genetic evolution of intelligence (Mendelian genetics – Conditional intelligence – Global Cognitive Theory) adjusts perfectly, showing an r² superior to 0.9 in several cases. Bearing in mind the tendency to increase the goodness of fit with the size of rearranged groups, we could assume it would be over 0,9 in almost all the cases for grander groups within a more significant sample.
2. Family - Intelligence of identical and non identical twins.
Family relationships are very interesting regarding genetics and intelligence, in fact, the whole EDI study is related to family characteristics.
Some research can be done regarding relations of identical twins, non identical twins, clones and even the effect of intelligence while selecting a partner or sexual selection.
Actually, we know that all C variables correspond to mono-environmental identical twin brothers, whereas W will only be a sibling; for that reason, sometimes they will look alike and others not so much.
It does not seem hard to imagine some interesting studies on these peculiar matters.
For instance, the selection of a partner as an auxiliary mechanism of evolution has been a paradigm since the first developments of the theory of evolution. Darwin himself wrote The Descent of Man and Selection in Relation to Sex (1871) introducing a new factor, sexual selection, through which females or males choose those with the most attractive qualities as their partner.
3. Significant comments on this particular graph
Although the explanation may not be very extensive, what is important here is that the model's adjustment substantially improves when this hypothesis of sexual selection is introduced. The hypothesis will affect, if introduced, only the M2 or F2 genes. These are estimated given that the measured IQs collect the power of the significant or less powerful gene, therefore, the estimations of M2 and F2 will change in light of the new information or condition introduced in the model.
The model will somewhat improve with the individual variables, but the effect will be noticed much more with the centered variables. The G-MCI with the rearrangement criterion M1F1, goes from 15.61 to 17 and the maximum r² from 0.89 to 0.97 for the objective function R (see figures Sim.cen.3 and Sexual selection).
For the objective function M&F the G-MCI is found at 17.62 while it was previously found at 17.77 and the maximum r² also rises from 0.89 to 0.97.
The maximum values of r² almost always correspond to the variable X6 or the average of six of the children's variables.

