
6.b.3) Sensitivity analysis - Globus Model
One of the objectives of The EDI Study is to test the genetic mechanisms in the transmission of intelligence. The Social Model achieved an astonishing sensitivity allowing for an explicit confirmation of the Conditional Evolution of Life (CEL) predictions.
A simplification of the Social model referred to evolution itself. The CEL indicates that genetic modifications indeed exist, intelligence increases throughout life by internal work, and it transmits to descendants. Now, the Global Model introduces this improvement in the simulation. Of course, complexity also intensifies while adding the correspondent combinatorial algorithms of error patterns.
Likewise, the new model has the possibility of incorporating asymmetric combinatorial algorithms to help to decrease the Multidimensional Correlation Index (MCI), internal evolution will only take place in the male genes; intricacy growths again. The reason behind this CEL assumption is that men are continually renewing their genetic load, and the ovules create at a very early age in girls.
Furthermore, by following the CEL model, there is an option to distinguish between direct and indirect internal evolution; in the former, the capacity will rise in a percentage of its value while in the latter, the increment will be a percentage of the potential of the other gene or, better said, chromosome. It implies an additional asymmetry and it will make the correlation drop a little more.
Now, the model is reaching very high levels of statistical complexity. However, computers greatly simplify the realization of mathematical simulation.
TABLE: INTERNAL EVOLUTION SENSITIVITY
|
Parameters Internal Evo.° |
T1-d, X3, X6 - arrangement criterion M1F1° | ||||||
| Objective function | |||||||
| Direct | Indirect | R° | M & F | ||||
| Mothers | Graphs | GMCI | r² max. | Graphs | GMCI | r² max. | |
| 5 | 5 | q071° | 14,14 | 0,72 | q072° | 14,46 | 0,72 |
| 3 | 3 | 14,21 | 0,82 | 14,81 | 0,82 | ||
| 1 | 1 | 13,49 | 0,80 | 13,89 | 0,80 | ||
| Null | |||||||
| 0 | 0 | q023 | 14,98 | 0,92 | q024 | 16,07 | 0,92 |
| Fathers | |||||||
| 1 | 1 | 14,06 | 0,83 | 16,10 | 0,87 | ||
| 2 | 3 | 14,79 | 0,87 | 16,10 | 0,87 | ||
| 3 | 3 | 15,33 | 0,84 | 16,47 | 0,84 | ||
| 4 | 4 | 15,09 | 0,84 | 16,73 | 0,84 | ||
| 5 | 5 | q063° | 15,61 | 0,89 | q064° | 17,77 | 0,89 |
| 6 | 6 | 14,30 | 0,95 | 16,74 | 0,95 | ||
| 7 | 7 | 13,25 | 0,83 | 15,56 | 0,83 | ||
| ° Internal evolution parameters affect the objective function R and M1F1 order | |||||||
The researchers even checked for a factor of minimum internal evolution, but they discarded it due to the low adjustments obtained.
Considering the internal evolution parameters will affect the objective function R° and vector M1F1° of the sample's previous arrangement, the changes in the correlations would infer variations in the goodness-of-fit and therefore permitting the optimization of their magnitude.
IQ group simulation
All the mechanisms of simulation allowing sensitivity analysis are the optimization algorithms. Their complexity derives from both the mathematical functions necessary for its statistical treatment and the considerable accumulation of small concepts and innovations.
The EDI Study comprises of around 500 million correlation coefficients.
The Globus Model refers to the optimization algorithms, the sensitivity analysis, and the different graphic presentation from the Global Model.
Regarding the results, the optimization with original variables is not as conclusive as with centered variables.
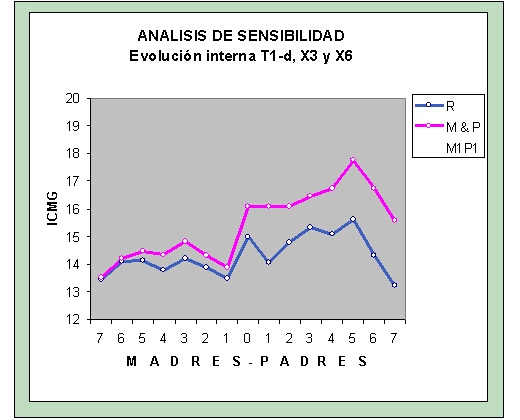
The graph shows the optimization done and that the best adjustment corresponds to a value of 5% for each of the parameters of internal evolution, direct and indirect. In other words, it means 10% growth in each generation of male genes. It is imperative to emphasize that the initial description of the Conditional Evolution of Life (1990) mentioned a figure of 10% while talking about this value.
Although additional studies with more data are convenient, due to the complexity of the model of the evolution of intelligence and all the combinatorial algorithms of error patterns, the differences in the MCI-G are sufficiently noteworthy.
Each point of the graph represents 30 determination coefficients, r², between variables M & F and the average of variables C, and those deviations balance not only for the centered children variables C but also for the rearranged grouping.
The previous statement will become apparent by looking at the corresponding graphs. With the figures, the density of the optimization algorithms transforms into an immediate visual perception of the underlying relationships in the Globus Model.
Regardless of all the graphs, here is the one reporting the highest adjustment for the R° function.
Above all, the improvement is more evident for the vectors of mean values X3 and X6 since T1-d worsens slightly for R° but not for M&F. It is as if T1-d lost some of its personality by cutting off the spikes of values.
The figure shows, with the graphic form of the Globus Model, the results are in the Optimization Algorithms of internal evolution chart.
Internal evolution I
Given the social sensitivity in these scientific areas, The EDI Study checked whether the opposite assumption of male-female evolution would work in the same fashion; in other words, supposing that only females changed genes. As expected, the adjustments are even worse than in a no-evolution situation.
The CEL explains in detail the basic argument that cancels any sexist interpretation, given the different biological function of men and women.
It is motivating to examine the X3 and X6 variables separately. Doubtlessly, X6 should present better results as the deviations of the natural combinatorial algorithms compensate more.
The observed peak for the null evolution, which would mean that both sexes contribute the same percentage to internal growth, has a problematic explanation from a genetics point of view. Among others, a precarious idea could be the possibility that not all men carry out the improvement of their genes due to a lack of confidence in Nature when indicators are present.
In this assumption, given the model sensitivity and the standardized variables, the first evolutionary increase of one percent would shrink the correlations, whereas when approaching the optimal value, the effect of a correct percentage of internal evolution would surpass the previous one.
In any way, the optimal amount of 5% of direct internal evolution and 5% of indirect internal evolution, of the capacity transmitted by men's genes is reasonably apparent.
The social aspect is not as severe as it seems bearing in mind, what the CEL says about the meaning of sexual differentiation. Women have the chief and arduous task of the initial development of children that implies a biological specialization in the technology of materials.
For that reason, the statistical simulation model has the parameter endogenous external, which gathers the evolutionary effect generated by women. It could imply an average increase of 5% with random distribution. However, since its variation affects neither the objective functions nor the criteria of arrangement, the model cannot verify it now.
Another argument is that some increase generated by men comes from changes due to the improvement of available materials thanks to the amelioration in the quality of their formation when they were in the womb.
On the other hand, it might be that women's genes have a backup function to maximize the guarantee of the viability of the new being. In the opposite case, Nature would be the first good programmer who would not make copies of its marvelous programs once they have acquired a certain degree of complexity and accumulated work.
The result of evolution parameters is the most outstanding of The EDI Study. If it is correct, it will imply the General Theory of Conditional Evolution of Life is right, at least, in its central idea of the existence of a finalist evolution and the abandonment of the theory of random mutations and, consequently, of natural selection as the primary mechanism of the genome development.
The complexity of the optimization algorithms of the Globus Model should not be an excuse for not recognizing the statistical evidence.